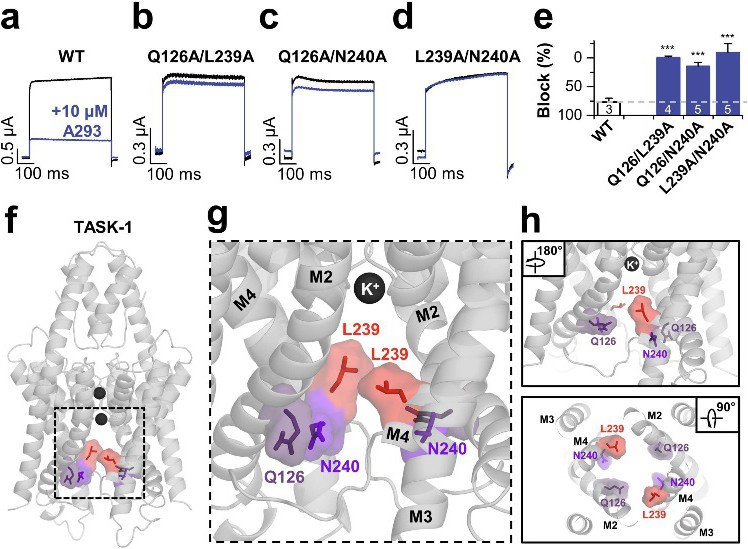
Fig. 3. Q126A, L239A and N240A are part of the A293 binding site: illustration in a TASK-1 pore homology model. (a-e) TASK-1 channels harboring combined mutations of the A293 binding site (double mutations with Q126A, L239A or N240A) show strongly reduced A293 sensitivity. (a-d) Representative current traces under control conditions (black) and after superfusion with 10 µM A293 (blue). (e) Analyses of the inhibition of Q126A/L239A, Q126A/N240A and L239A/N240A double mutants by 10 µM A293. Data are provided as mean ± S.E.M. *** p<0.001 vs. WT. (f-g) TWIK-1-based TASK-1 homology model illustrating the A293 binding site at the lower end of the central cavity. (f) Overview illustrating the location of Q126A, L239A and N240A in TASK-1 and (g) zoom into the central cavity. (f-g) Note that the view into the central cavity is possible through the large lateral side fenestrations. (h) Lateral view as in (g) but from the other side of the channel. The lower panel illustrates the view from inside the cell into the central cavity.